Where Does EEG Come From and What Does It Mean?
🔥INFO
Blog: 2025/07/18 by IgniSavium
- Title: Where Does EEG Come From and What Does It Mean?
- Authors: Michael X Cohen (Radboud University)
- Published: April 2017
- Comment: Trends in Neurosciences
- URL: https://www.cell.com/trends/neurosciences/abstract/S0166-2236(17)30024-3?_returnURL=https%3A%2F%2Flinkinghub.elsevier.com%2Fretrieve%2Fpii%2FS0166223617300243%3Fshowall%3Dtrue
🥜TLDR: A comprehensive introduction about EEG and its related studies (more from a physiological perspective). We mainly study the typical wave forms or patterns in EEG.
Motivation
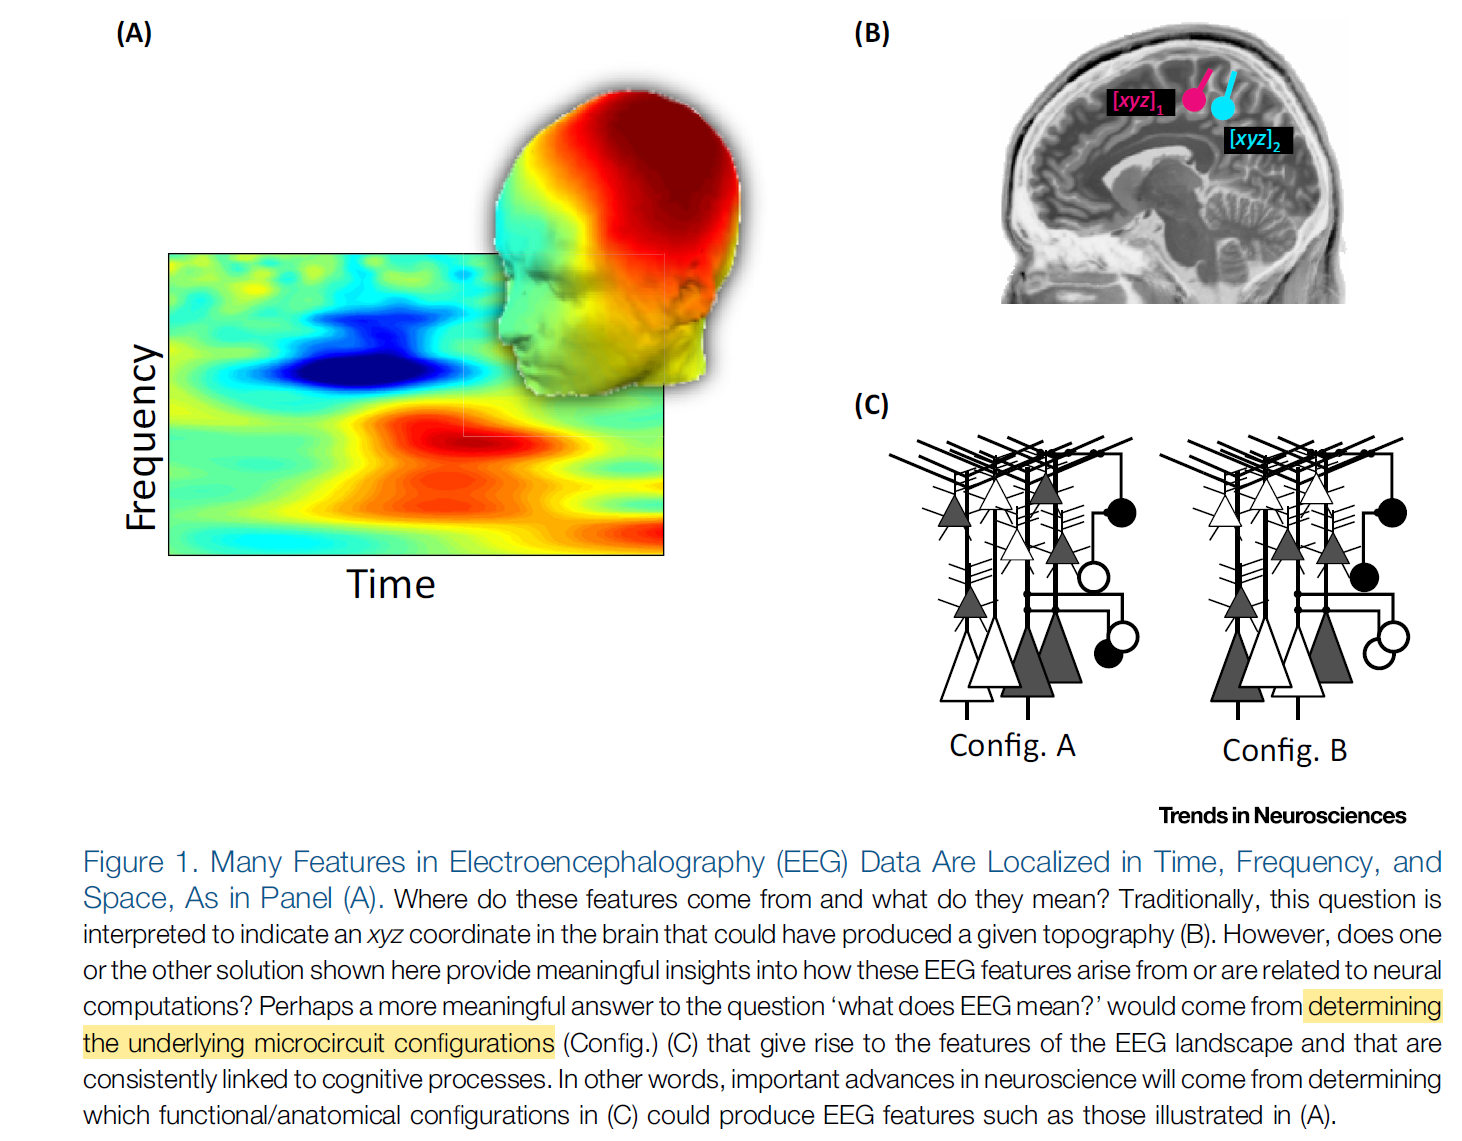
This paper emphasizes that the real, often overlooked question is not merely where EEG signals originate anatomically, but what they truly represent in terms of underlying neural circuit dynamics—arguing that we still understand surprisingly little about this relationship and highlighting the need to bridge this gap using modern neuroscience tools and a focus on interpretable EEG features like neural oscillations.
cognitive process <-neural circuit dynamics -> EEG signals
"Therefore, the right question is: what are the neural microcircuit functional/anatomical configurations – the dynamics within and among different classes of cells, different layers within the cortex, and different columns across the cortical sheet – that produce the various spatial/spectral/temporal EEG features that have been linked to cognitive processes?"
EEG feature: this term is used here as shorthand for an idiosyncratic spatial/temporal/spectral pattern that is associated with a particular sensory or cognitive process, similar to a ‘fingerprint’. Examples include midfrontal theta and response conflict monitoring, and posterior alpha power and spatial attention.
EEG itself
Electroencephalography (EEG): the measurement of brain electrical fields via electrodes (which act as small antennas) placed on the head (non-invasive). The electrical fields are the result of electrochemical signals passing from one neuron to the next. When billions of these tiny signals are passed simultaneously in spatially extended and geometrically aligned neural populations, the electrical fields sum and become powerful enough to be measured from outside the head.
Perhaps the main disadvantage is that EEG is limited to large, synchronous populations of neurons; small-scale and asynchronous activity is difficult or impossible to measure.
The origins of the local field potential (LFP) and EEG: the (here termed) ‘standard model’ states that LFP and EEG are the extracellular currents reflecting summed dendritic postsynaptic potentials (the exchange of electrochemical signaling across the synapse) in thousands to millions of pyramidal cells in parallel alignment.
EEG patterns
Two representative waves
Alpha Waves (8–12 Hz)
- What it is: A type of brain wave commonly observed when a person is relaxed, eyes closed, but still awake. It reflects the brain's mechanism for suppressing irrelevant information while maintaining rhythmic attentional control.
- Key Identification Features: Stable frequency, strong energy, and clearly visible on EEG charts.
- Computer Recognition Methods:
- Can extract signals in the 8–12 Hz range using Fast Fourier Transform (FFT)(快速傅里叶变换) or Power Spectral Density (PSD) analysis(功率谱密度分析).
- Simple spectral analysis tools(频谱分析工具) can accurately detect these waves.
- Very easy to observe during eye-closed or resting states; one of the easiest types of brain waves to identify.
Gamma Waves (30–80 Hz)
- What it is: High-speed brain waves that occur during active perception, focused attention, and information integration. They may help coordinate the synchronized activity of neural populations.
- Identification Challenges:
- High frequency with short duration;
- Easily masked by electromyographic noise or external interference;
- Low signal-to-noise ratio in standard EEG equipment, making them more challenging to identify.
- Computer Recognition Methods:
- Use time-frequency analysis methods like Wavelet Transform(小波变换) or Short-Time Fourier Transform (STFT)(短时傅里叶变换) to capture transient high-frequency components.
- Apply blind source separation techniques such as Independent Component Analysis (ICA)(独立成分分析) to remove artifacts and noise.
- Multi-channel spatial information analysis, such as Common Spatial Patterns (CSP)(共空间模式) and signal envelope analysis(信号包络分析), may be required to improve recognition accuracy.
| EEG Waveform | Functional Role | Recognition Difficulty | Common Computational Methods | Challenges & Advantages |
|---|---|---|---|---|
| Alpha | Noise suppression, attention maintenance | ✅ Easy to recognize | FFT, PSD, Band-pass filtering | Clear waveform, stable frequency |
| Gamma | Sensory processing, synchronization | ⚠️ More difficult to recognize | Wavelet transform, ICA, STFT, CSP, etc. | High-frequency noise, requires advanced denoising and signal enhancement |
General Easily-Recognizable Patterns
- Classic Band Oscillations 经典带状振荡
- α Waves (8–13 Hz): Large amplitude, prominent in the occipital region during eyes-closed rest, easy to identify.
- β Waves (13–30 Hz): High frequency, linked to alertness and attention, stable recognition.
- θ Waves (4–8 Hz): Clear waveform during specific tasks or sleep stages.
-
δ Waves (0.5–4 Hz): High amplitude, slow cycles in deep sleep, easily detectable.
-
Event-Related Potentials (ERPs) 事件相关电位
-
Time-locked waveforms like P300, N400, with high clarity and repeatability after averaging trials.
-
Transient Bursts 瞬态爆发
-
Brief but noticeable enhancements of α or θ waves, easily captured via time-frequency analysis.
-
Non-Sinusoidal Patterns (e.g., Up-Down States) 非正弦模式
-
Periodic, large-amplitude asymmetric waves during anesthesia or deep sleep, visually distinguishable.
-
Spatially Distinct Patterns 空间独特模式
- Stable spatial distribution of α waves in the occipital region under high-density EEG, easy to localize.